Volume analysis ek important aspect hai stock market technical analysis ka. Price movement ke sath-sath volume ka analysis karke aap market ke strength, direction, aur potential reversals ko identify kar sakte hain. Volume trading ka ek essential tool hai, jo price trends ko validate karta hai aur potential market movements ke signals deta hai. Is article mein, hum volume analysis ko samjhenge, aur yeh kaise aapke trading decisions ko enhance kar sakta hai, is par focus karenge.
What is Volume in Stock Trading?
Volume ek indicator hai jo aapko batata hai kitni quantity mein kisi stock ya asset ka trading ho raha hai. Yeh ek bar chart ki tarah display hota hai jisme har bar ke height ko represent karta hai total number of shares ya contracts traded in a specific time period.
Stock trading mein, volume ka analysis aapko stock ke price movement ko samajhne mein madad karta hai. Agar price ke sath volume badh raha ho, to yeh indicate karta hai ki price movement strong hai. Agar price badh raha ho lekin volume kam ho, to yeh signal de sakta hai ki movement weak hai aur reversal ho sakta hai.
Why is Volume Important in Trading?
Volume ko samajhna isliye zaroori hai kyunki:
- Market Sentiment: Volume market sentiment ko reflect karta hai. Jab volume high hota hai, to market mein excitement ya fear ho sakti hai, jo kisi specific price movement ke sath hota hai.
- Trend Confirmation: Volume ko price trends ke saath compare karne se aap trends ki strength ko assess kar sakte hain. High volume with price increase indicates a strong bullish trend, whereas low volume with price increase signals a weak trend.
- Potential Reversals: Jab volume suddenly increase hota hai, to yeh reversal ka signal bhi ho sakta hai, especially jab price trend oppositely move karta ho.
How to Read Volume in Charts
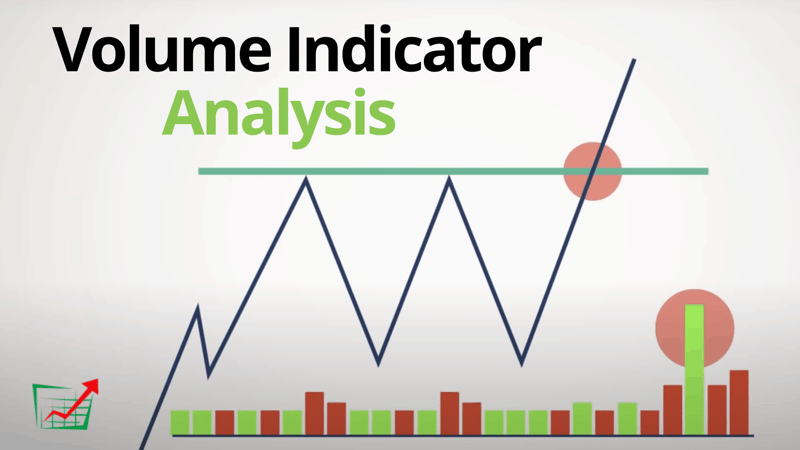
Volume ko chart par samajhna kaafi simple hai. Aap volume ko kisi bhi charting tool ke sath dekh sakte hain. Volume bars usually price chart ke neeche plot hote hain. Har bar ka size uss particular time period mein total traded volume ko represent karta hai.
- Bullish Trend + High Volume: Jab price upward move kar raha ho aur volume high ho, to yeh strong bullish trend ka signal hai. Yeh market mein increased buying activity ko dikhata hai aur trend ko continue karne ka indication deta hai. Example: Agar kisi stock ka price 5% increase ho raha hai aur volume bhi significantly increase ho raha hai, to yeh indicate karta hai ki demand strong hai aur price movement sustainable ho sakta hai.
- Bearish Trend + High Volume: Agar price downward movement dikha raha ho aur volume high ho, to yeh strong bearish trend ka signal hai. Yeh market mein increased selling activity ko reflect karta hai aur price aur niche jaane ka indication de sakta hai. Example: Agar price 5% decrease ho raha hai aur volume increase ho raha hai, to yeh strong selling pressure ko indicate karta hai.
- Bullish Trend + Low Volume: Agar price upward move kar raha ho lekin volume low ho, to yeh signal de sakta hai ki price movement weak ho sakti hai. Volume ka low hona indicate karta hai ki buying activity zyada strong nahi hai, aur trend short-lived ho sakta hai. Example: Agar stock ka price increase ho raha hai lekin volume kaafi kam hai, to yeh weak bullish signal ho sakta hai, jisme reversal ka risk ho sakta hai.
- Bearish Trend + Low Volume: Agar price downward move kar raha ho lekin volume low ho, to yeh indicate karta hai ki selling pressure weak hai. Iska matlab ho sakta hai ki bearish trend sustainable nahi hai aur reversal ho sakta hai. Example: Agar price decrease ho raha ho lekin volume kaafi kam hai, to yeh weak bearish signal ho sakta hai.
Volume-Based Patterns
Volume analysis kaafi important hai jab aap price charts par patterns dekh rahe hote hain. Kuch specific volume-based patterns hain jo aapko price reversal ya trend continuation ko identify karne mein madad karte hain:
- Volume Spikes: Jab volume suddenly bahut zyada increase ho jaata hai, to yeh market mein kisi significant event ya news ka result ho sakta hai. Aise spikes ko carefully monitor karna zaroori hai, kyunki yeh price reversal ya breakout signal de sakte hain. Example: Agar stock ka price increase ho raha ho aur suddenly volume spike ho, to yeh breakout ka signal ho sakta hai.
- Volume Dry-Up (Low Volume): Jab kisi trend ke beech volume significantly decrease ho jaata hai, to yeh market mein lack of interest ko dikhata hai. Aise periods mein price trend weak ho sakta hai aur market mein chhupay hue reversal signals ho sakte hain. Example: Agar price range-bound ho aur volume kaafi low ho, to yeh signal de sakta hai ki market mein koi direction nahi hai aur breakout ho sakta hai.
- Volume Confirmation in Chart Patterns: Chart patterns jaise Head and Shoulders, Double Top/Bottom, Triangles, etc., ko volume ke saath combine karke unki reliability ko assess kiya ja sakta hai. Agar volume pattern ke breakouts ya breakdowns ke sath match kar raha ho, to yeh signals ko zyada reliable bana sakta hai.
Key Volume Indicators to Use
- On-Balance Volume (OBV): OBV ek volume-based indicator hai jo price movement ke sath volume ko integrate karta hai. Agar OBV rise kar raha ho, to yeh indicate karta hai ki volume buying activity ke saath increase ho raha hai. Agar OBV decline ho raha ho, to yeh indicate karta hai ki selling activity zyada ho rahi hai.
- Accumulation/Distribution (A/D): A/D indicator bhi volume aur price ke relation ko measure karta hai. Agar A/D line increase ho rahi ho, to yeh indicate karta hai ki market mein accumulation (buying) ho rahi hai. Agar A/D line decline kar rahi ho, to yeh distribution (selling) ko dikhata hai.
- Chaikin Money Flow (CMF): CMF indicator price aur volume ko combine karke market ke buying aur selling pressure ko show karta hai. Positive CMF value indicate karti hai ki buying pressure dominant hai, jabki negative CMF selling pressure ko indicate karta hai.
Volume and Market Psychology
Volume ka analysis aapko market psychology ko samajhne mein madad karta hai. Jab market mein zyada volume hota hai, to log apne positions ko aggressively buy ya sell kar rahe hote hain. High volume indicate karta hai ki market mein participation zyada hai aur price movements genuine aur sustainable ho sakte hain.
Conversely, low volume indicate karta hai ki market mein interest kam hai, jo price movements ko unreliable bana sakta hai. Isliye volume ke analysis ko price movement ke sath closely dekhna zaroori hai, taki aap trend ki strength aur sustainability ko accurately assess kar sakein.
Conclusion
Volume analysis ek critical tool hai jo price action ke analysis ko validate karta hai aur market movements ko samajhne mein madad karta hai. Jab aap volume ko price trends ke saath read karte hain, to aap better decisions le sakte hain regarding buying, selling, aur holding positions. Volume ko samajhna aapko not just trends ke baare mein batata hai, balki yeh market ki overall health aur strength ko bhi reflect karta hai.
Key Takeaways:
- High Volume with rising prices indicates strong market support.
- Low Volume with rising prices signals weak bullish trends.
- Volume spikes can signal major market events like breakouts or reversals.
- Volume analysis should be used in combination with other technical indicators for better decision-making.
Is analysis ko apne trading strategy mein include kar ke aap apni trading approach ko zyada effective bana sakte hain aur better market predictions kar sakte hain.
4o mini