Fundamental analysis ek trading aur investing ka important approach hai, jo ek company ya asset ki intrinsic value ko assess karta hai. Isme company ke financial health, growth potential, aur market position ko samajhne ki koshish ki jaati hai. Jab aap stock ya asset ko purchase karne ki soch rahe hote hain, to fundamental analysis aapko uski true value aur uski long-term potential ko evaluate karne mein madad karta hai. Is article mein hum discuss karenge 5 key metrics jo fundamental analysis mein aapko zaroor consider karne chahiye.
1. Price-to-Earnings (P/E) Ratio
Price-to-Earnings (P/E) ratio ek common aur widely used metric hai, jo ek company ke stock price ko uski earnings (profit) ke saath compare karta hai. Yeh metric investor ko yeh batata hai ki stock ka price company ke earnings ke hisaab se kahan stand karta hai.
How to Calculate P/E Ratio:
P/E ratio ko calculate karne ka formula yeh hota hai:P/E Ratio=Market Price per ShareEarnings per Share (EPS)\text{P/E Ratio} = \frac{\text{Market Price per Share}}{\text{Earnings per Share (EPS)}}P/E Ratio=Earnings per Share (EPS)Market Price per Share
Jahan:
- Market Price per Share: Stock ka current market price.
- Earnings per Share (EPS): Company ka net income divided by total outstanding shares.
What it Tells You:
- High P/E Ratio: Agar ek company ka P/E ratio industry ke comparison mein zyada hai, to yeh indicate karta hai ki investors us stock ko overvalued samajh rahe hain, ya company future growth ke liye optimistic hain.
- Low P/E Ratio: Agar P/E ratio kam hai, to yeh stock undervalued ho sakta hai, ya company ki earnings growth potential low ho sakti hai.
P/E ratio ko aap industry average ke saath compare kar sakte hain, kyunki har industry ka average P/E ratio alag hota hai.
2. Price-to-Book (P/B) Ratio
Price-to-Book (P/B) ratio ek aur important metric hai jo company ke market value ko uske book value (net assets) se compare karta hai. Yeh metric aapko yeh batata hai ki market mein company ka stock price uske assets ke comparison mein kis level par trade kar raha hai.
How to Calculate P/B Ratio:
P/B Ratio=Market Price per ShareBook Value per Share\text{P/B Ratio} = \frac{\text{Market Price per Share}}{\text{Book Value per Share}}P/B Ratio=Book Value per ShareMarket Price per Share
Jahan:
- Book Value per Share: Company ke total assets minus total liabilities divided by number of outstanding shares.
What it Tells You:
- P/B Ratio > 1: Agar P/B ratio 1 se zyada hai, to yeh indicate karta hai ki market company ke assets ko uski book value se zyada price de raha hai.
- P/B Ratio < 1: Agar P/B ratio 1 se kam hai, to yeh indicate karta hai ki company ke assets ki market value uske book value se kam hai, jo ki undervaluation ka signal ho sakta hai.
P/B ratio ko bhi aap industry ke comparison mein dekh sakte hain, kyunki different industries mein assets ki valuation alag hoti hai.
3. Dividend Yield
Dividend yield ek important metric hai, jo ek company ke dividend payments ko uske stock price ke saath compare karta hai. Yeh metric aapko yeh batata hai ki company apne shareholders ko kitna return de rahi hai, relative to its share price.
How to Calculate Dividend Yield:
Dividend Yield=Annual Dividend per ShareMarket Price per Share\text{Dividend Yield} = \frac{\text{Annual Dividend per Share}}{\text{Market Price per Share}}Dividend Yield=Market Price per ShareAnnual Dividend per Share
What it Tells You:
- High Dividend Yield: Agar company ka dividend yield high hai, to yeh ek positive indicator ho sakta hai, especially for income-focused investors jo regular cash flow chahte hain. Lekin, high dividend yield kabhi-kabhi company ke financial issues ko bhi indicate kar sakta hai, isliye is metric ko carefully analyze karna zaroori hai.
- Low Dividend Yield: Agar dividend yield kam hai, to yeh indicate karta hai ki company apne profits ka zyada hissa reinvest kar rahi hai rather than paying it out as dividends. Growth-oriented companies mein yeh common hota hai.
4. Debt-to-Equity (D/E) Ratio
Debt-to-Equity (D/E) ratio ek important leverage ratio hai jo ek company ke financial structure ko analyze karta hai. Yeh metric company ke total debt ko uske shareholders’ equity ke saath compare karta hai. Isse yeh samajhne mein madad milti hai ki company apne growth ko finance karne ke liye kitna debt use kar rahi hai.
How to Calculate D/E Ratio:
D/E Ratio=Total DebtShareholders’ Equity\text{D/E Ratio} = \frac{\text{Total Debt}}{\text{Shareholders’ Equity}}D/E Ratio=Shareholders’ EquityTotal Debt
What it Tells You:
- High D/E Ratio: Agar D/E ratio high hai, to company apne operations ko finance karne ke liye zyada debt par dependent hai. Yeh risk ka indicator ho sakta hai, kyunki company ko apne debt obligations ko time par fulfill karna hota hai.
- Low D/E Ratio: Agar D/E ratio low hai, to company ka financial risk comparatively kam hota hai, kyunki uska debt burden low hai.
Aap is ratio ko company ke industry peers ke saath compare kar sakte hain, kyunki industries ka debt structure alag hota hai.
5. Earnings per Share (EPS)
Earnings per Share (EPS) ek fundamental metric hai jo company ke profitability ko measure karta hai. Yeh metric company ke net income ko uske outstanding shares ke number se divide karke calculate kiya jaata hai. EPS investor ko yeh batata hai ki ek share par kitni earnings ho rahi hain.
How to Calculate EPS:
EPS=Net Income−Preferred DividendsNumber of Outstanding Shares\text{EPS} = \frac{\text{Net Income} – \text{Preferred Dividends}}{\text{Number of Outstanding Shares}}EPS=Number of Outstanding SharesNet Income−Preferred Dividends
What it Tells You:
- Higher EPS: Jab EPS zyada hota hai, to yeh indicate karta hai ki company profitably operate kar rahi hai aur shareholders ko zyada return de sakti hai.
- Lower EPS: Agar EPS low hai, to yeh indicate karta hai ki company ki profitability low hai, ya company ko apne operations mein challenges ka samna ho sakta hai.
EPS ka analysis aap past years ke comparison mein kar sakte hain taaki aapko company ke earnings growth ka clear picture mil sake.
Conclusion
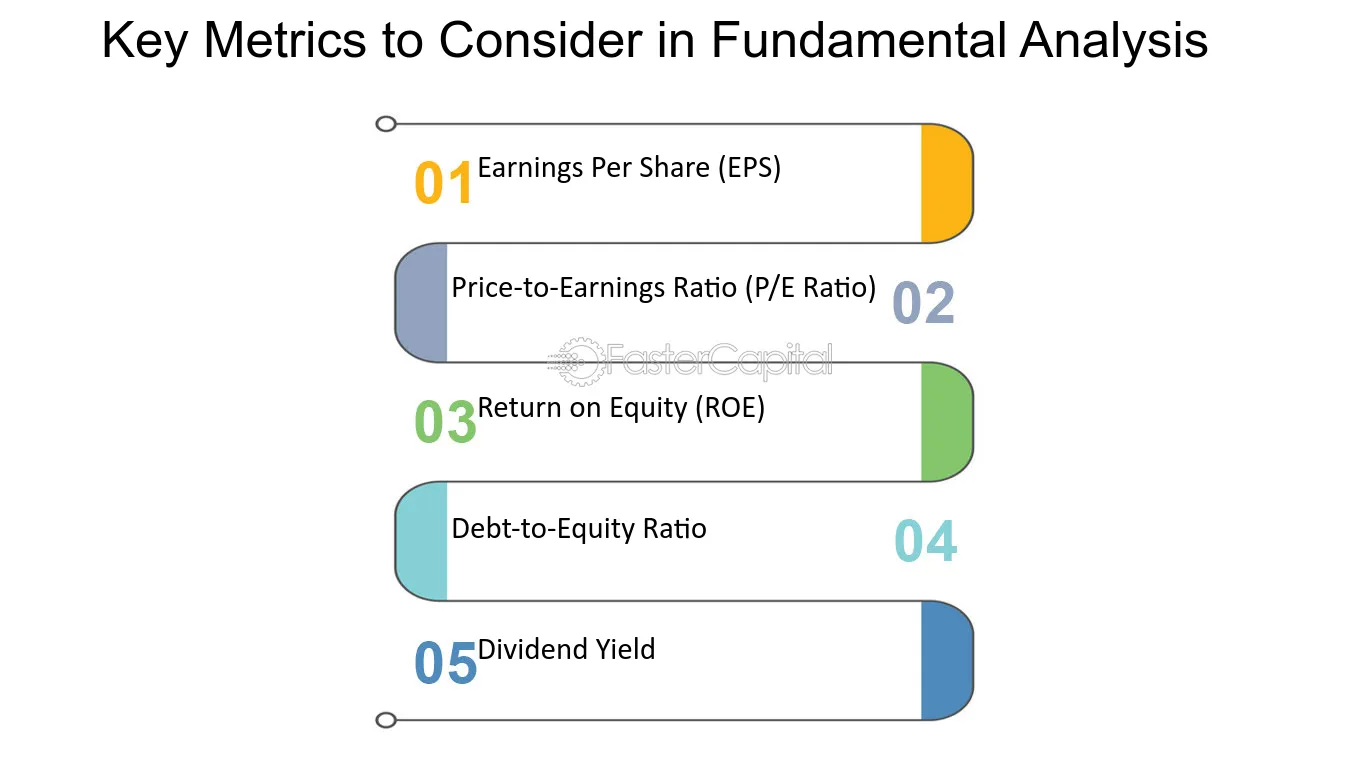
Fundamental analysis ka use karte waqt, in 5 key metrics ko samajhna aur analyze karna zaroori hota hai. P/E ratio, P/B ratio, dividend yield, D/E ratio, aur EPS, yeh sab important tools hain jo aapko company ki financial health aur growth potential ko assess karne mein madad karte hain. In metrics ko carefully evaluate karke, aap informed investment decisions le sakte hain aur apni portfolio strategy ko optimize kar sakte hain.
4o mini