The Price-to-Earnings ratio (P/E ratio) is one of the most widely used metrics in stock trading and investing. It is an essential tool that helps investors assess the valuation of a company relative to its earnings. Understanding how to interpret the P/E ratio can significantly improve decision-making when selecting stocks to buy or sell. In this article, we’ll dive into the concept of the P/E ratio, how it’s calculated, its types, and how it’s used in evaluating stocks.
What is the P/E Ratio?
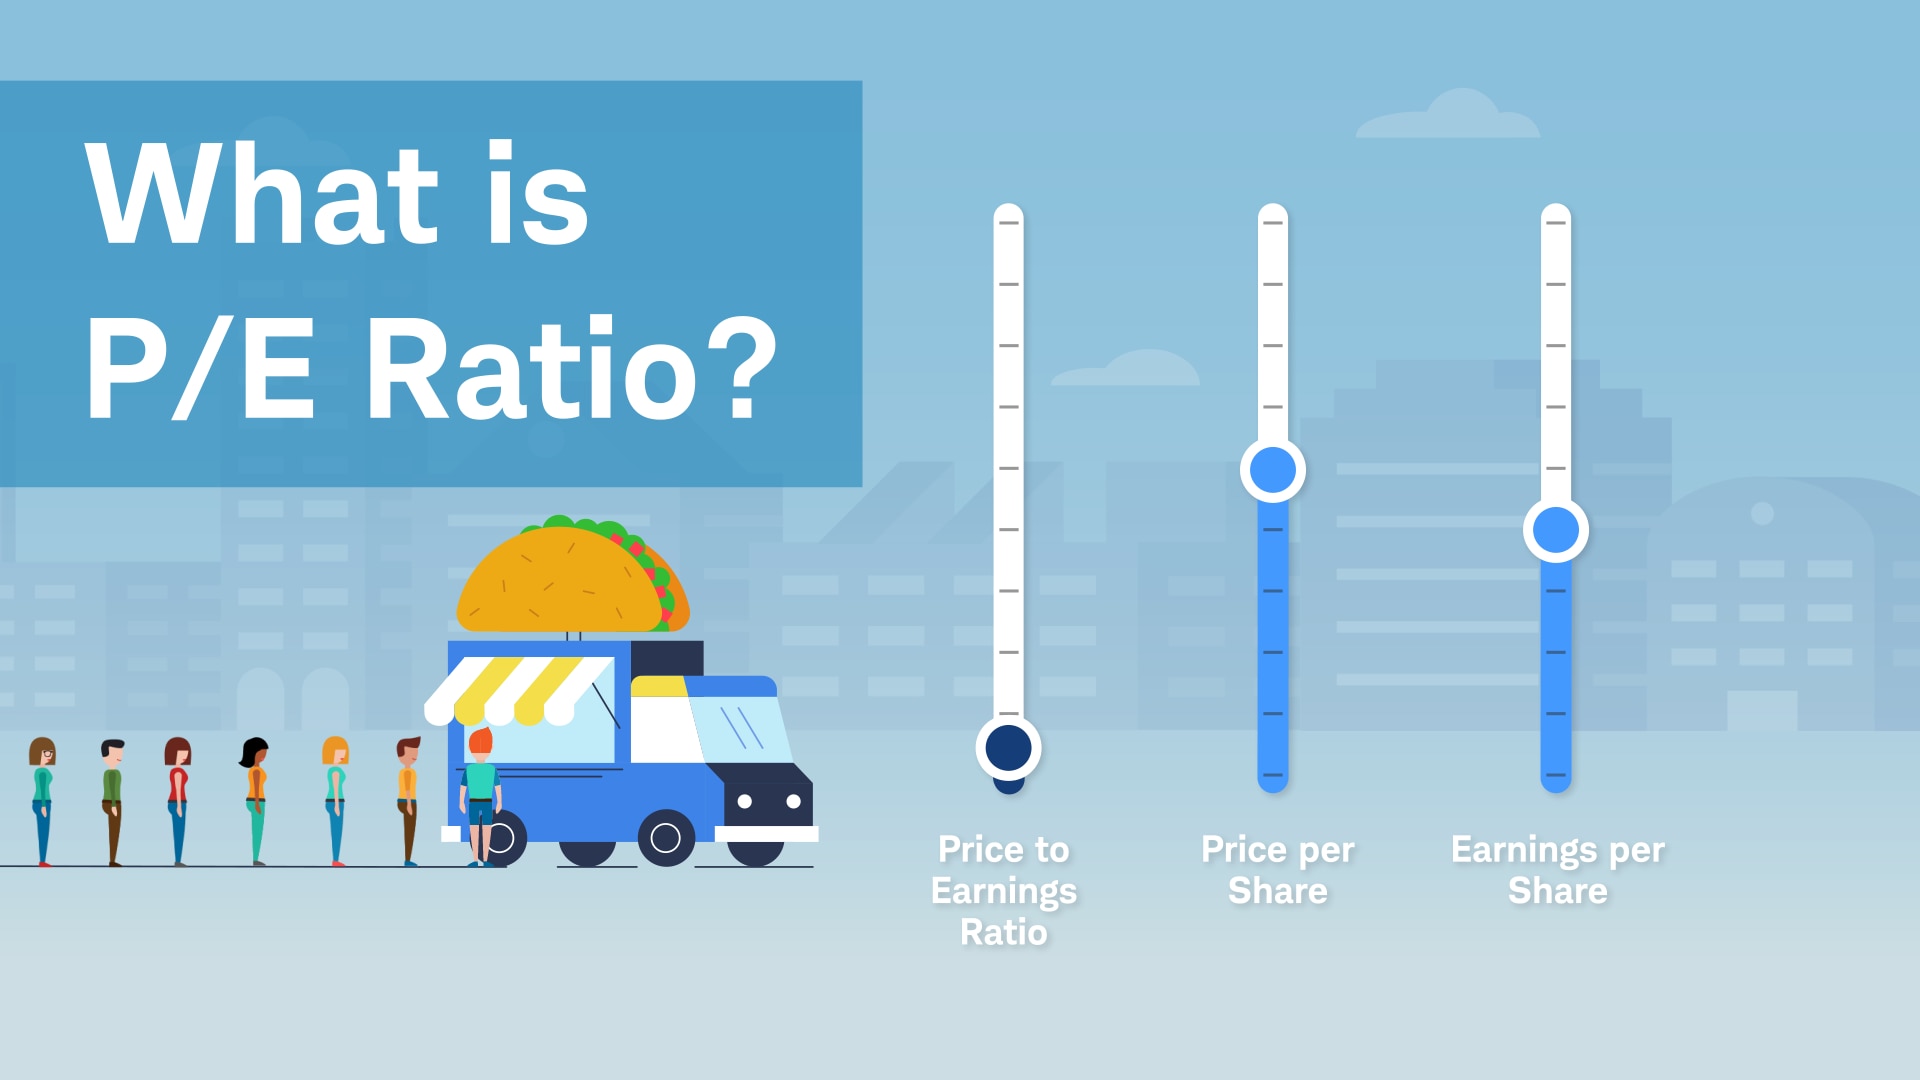
The Price-to-Earnings (P/E) ratio is a financial metric used to measure the relative value of a company’s stock. It compares a company’s market price per share to its earnings per share (EPS). The P/E ratio helps investors understand how much they are paying for each dollar of the company’s earnings, indicating whether a stock is overvalued, undervalued, or fairly valued.
The P/E ratio is calculated using the following formula: P/E Ratio=Price Per ShareEarnings Per Share (EPS)P/E\ Ratio = \frac{Price\ Per\ Share}{Earnings\ Per\ Share\ (EPS)}P/E Ratio=Earnings Per Share (EPS)Price Per Share
Where:
- Price Per Share is the current market price of one share of the stock.
- Earnings Per Share (EPS) is the company’s net profit divided by the number of outstanding shares.
Types of P/E Ratios
There are two main types of P/E ratios commonly used in stock trading:
- Trailing P/E Ratio:
- The trailing P/E ratio is calculated using the company’s earnings over the last 12 months (trailing twelve months or TTM).
- This is the most commonly used P/E ratio and provides a snapshot of how the market values a company based on its recent performance.
- Forward P/E Ratio:
- The forward P/E ratio is based on analysts’ estimates of the company’s future earnings (usually the next 12 months).
- It gives a forecast of how much investors are willing to pay for each dollar of anticipated earnings.
How to Interpret the P/E Ratio
The P/E ratio provides valuable insights into how the market perceives a company’s potential for growth and profitability. Here’s how to interpret the ratio:
- High P/E Ratio:
- A high P/E ratio typically indicates that investors are expecting high growth in the future. Investors may be willing to pay a premium for a stock because they believe the company will generate substantial earnings growth.
- However, a high P/E ratio can also suggest that the stock is overvalued, and the market’s expectations for future growth might be too optimistic.
- Low P/E Ratio:
- A low P/E ratio may indicate that a stock is undervalued or that the company is not expected to grow significantly in the future. It can also suggest that the company is experiencing difficulties or is in a declining industry.
- However, a low P/E ratio does not always mean a bargain, as it may reflect poor future prospects.
P/E Ratio in Different Market Contexts
The P/E ratio should not be analyzed in isolation. It is essential to compare a company’s P/E ratio with several other factors to get a complete picture of its valuation:
- Industry Comparisons:
- Different industries have different typical P/E ratios. For example, technology stocks often have higher P/E ratios than utility stocks because tech companies are expected to grow faster.
- Comparing the P/E ratio of a company with its peers within the same industry provides a better perspective on its valuation.
- Growth Stocks vs. Value Stocks:
- Growth stocks typically have higher P/E ratios because they are expected to grow their earnings at a faster rate. These stocks are often bought with the expectation of future price appreciation.
- Value stocks usually have lower P/E ratios, which may indicate they are undervalued relative to their earnings potential. Investors in value stocks often seek to buy stocks at a lower price relative to earnings.
P/E Ratio in Stock Valuation
The P/E ratio is a quick and simple way to evaluate whether a stock is overvalued or undervalued, but it should not be the sole metric used to make investment decisions. Here are a few additional factors to consider when using the P/E ratio:
- Growth Rate and P/E Ratio:
- If a company has a high P/E ratio but also demonstrates a high growth rate, it may still be a good investment. In this case, the high P/E ratio reflects the company’s strong future earnings potential.
- The PEG (Price-to-Earnings Growth) ratio is often used to address this issue, as it compares the P/E ratio to the company’s growth rate.
- Earnings Quality:
- The P/E ratio is based on reported earnings, but the quality of these earnings matters. A company that has high earnings due to one-time gains or accounting tricks may have a misleadingly high P/E ratio. Therefore, examining the company’s earnings history and sustainability is critical.
- Economic and Market Conditions:
- The P/E ratio is also influenced by broader market and economic conditions. In a bull market, P/E ratios tend to be higher across the board, whereas in a bear market, P/E ratios may fall.
Limitations of the P/E Ratio
While the P/E ratio is a useful tool, it has limitations that investors should keep in mind:
- Doesn’t Consider Debt:
- The P/E ratio doesn’t account for a company’s level of debt. A company with high debt may have a lower P/E ratio due to its financial risk, which could affect future earnings.
- Earnings Volatility:
- For companies with highly volatile earnings (such as startups or cyclical industries), the P/E ratio may not provide an accurate representation of their value.
- Not Useful for Loss-Making Companies:
- The P/E ratio is not meaningful for companies that are not profitable or have negative earnings. In such cases, investors often look at other metrics such as price-to-sales (P/S) ratio or EV/EBITDA.
Conclusion
The P/E ratio is a powerful tool in stock trading that helps investors quickly assess whether a stock is expensive or cheap relative to its earnings. However, it should not be used in isolation. It’s essential to consider the P/E ratio in the context of industry averages, the company’s growth prospects, and overall market conditions. By combining the P/E ratio with other valuation metrics and fundamental analysis, investors can make more informed decisions when trading stocks.
Understanding how to use the P/E ratio effectively is an essential skill for any trader or investor. Whether you are looking for growth stocks or value stocks, the P/E ratio can provide valuable insights into a company’s current and future financial health.