How to Identify Support and Resistance Levels
Support aur resistance levels, technical analysis ka core concept hain, jo har trader ko apne trading decisions ko guide karne ke liye samajhna zaroori hota hai. Support wo price level hota hai jahan price neeche jaane ke baad ruk jaata hai ya reverse hota hai, jabki resistance wo level hota hai jahan price upar jaane ke baad ruk jaata hai ya reverse ho jaata hai. Yeh levels market ki psychology aur price action ko samajhne mein madad karte hain. Is article mein hum discuss karenge ki aap support aur resistance levels ko kaise identify kar sakte hain.
Support Levels
Support level wo price level hota hai jahan buyers ka pressure itna zyada hota hai ki price neeche nahi jaa pata. Yahan par buyers market mein entry karte hain, aur price ko niche girne se rokne ki koshish karte hain. Support level kaafi important hota hai, kyunki agar price is level ko break kar jaata hai, to price aur neeche jaane ka potential rakhta hai.
How to Identify Support Levels:
- Previous Lows: Support level identify karne ke liye sabse pehla step yeh hai ki aap chart par previous lows dekhain. Agar price kisi particular level par pehle reverse hua ho, to woh support level ho sakta hai.
- Flat Regions or Consolidation Areas: Agar price kisi range mein move kar raha ho, jahan wo bar-bar upar aur neeche ho raha ho, to woh area support ban sakta hai, especially jab price wahan se baar baar bounce ho.
- Round Numbers: Financial markets mein log round numbers ko psychological barriers ki tarah treat karte hain. Jaise 1000, 50, 20, etc. Ye round numbers bhi support ban sakte hain, kyunki market participants unhe important maante hain.
- Volume Analysis: Agar price support level ke aas-paas form ho raha ho aur volume increase ho raha ho, to yeh support level ka confirmation ho sakta hai. High volume se pata chalta hai ki buyers active hain.
Example of Support:
Agar ek stock ka price pehle 100 rupees par ruka ho aur wahan se upar gaya ho, to 100 rupees ka level support ka kaam karega. Agar price wapas is level ko test kare aur phir se upar jaye, to yeh confirm hota hai ki 100 rupees strong support level hai.
Resistance Levels
Resistance level wo price point hota hai jahan sellers ka pressure itna strong hota hai ki price aur upar nahi jaata. Yahan sellers market mein enter karte hain, aur price ko upper levels par badhne se rokne ki koshish karte hain. Jab price resistance level ko break karta hai, to yeh bullish signal hota hai.
How to Identify Resistance Levels:
- Previous Highs: Resistance level ko identify karne ka sabse asaan tareeka previous highs ko dekhna hota hai. Agar price kisi particular point par pehle reverse ho chuka ho, to woh level resistance ban sakta hai.
- Trendlines: Agar price consistently ek line ke across ja raha ho, to aap trendline draw kar ke resistance levels identify kar sakte hain. Yeh trendline market ki overall movement ko represent karti hai aur resistance ka kaam karti hai.
- Psychological Levels: Jaise support ke liye round numbers important hote hain, waise resistance ke liye bhi ye numbers important ho sakte hain. Agar price 150 rupees ke level par baar baar rukta hai, to 150 rupees ka level resistance ho sakta hai.
- Volume Analysis: Resistance level ke paas volume ka increase hona bhi ek indicator ho sakta hai, jo indicate karta hai ki sellers us level par active hain aur price ko upar jane nahi denge.
Example of Resistance:
Agar kisi stock ka price pehle 200 rupees par rukta hai aur phir neeche aata hai, to 200 rupees ka level resistance level ho sakta hai. Jab price wahan se baar baar reverse hota hai, tab is level ko resistance ka indication milta hai.
How to Use Support and Resistance Levels in Your Trading
Support aur resistance levels ko identify karna trading strategies ko implement karne mein madadgar ho sakta hai. Yeh levels aapko entry aur exit points batane mein madad karte hain.
- Trend Confirmation: Jab price support ke upar move karta hai ya resistance ko break karta hai, to yeh ek strong trend confirmation hota hai. Agar price support level ke upar hai, to market bullish ho sakta hai, aur agar resistance ke neeche hai, to market bearish ho sakta hai.
- Stop-Loss and Take-Profit Levels: Support aur resistance levels ko aap apne stop-loss aur take-profit levels set karne ke liye use kar sakte hain. Agar aap ek long position hold kar rahe hain, to aap stop-loss ko support level ke thoda neeche set kar sakte hain. Agar aap short position hold kar rahe hain, to aap stop-loss ko resistance ke thoda upar set kar sakte hain.
- Breakout and Breakdown Trading: Jab price support level ko break karta hai, to aap short trade enter kar sakte hain. Jab price resistance level ko break karta hai, to aap long trade enter kar sakte hain. Yeh breakouts aur breakdowns strong market trends ki taraf indicate karte hain.
- Consolidation Zones: Agar price ek range mein move kar raha ho, to aap support aur resistance levels ko identify karke consolidation zones mein trades kar sakte hain. Aap support par buy karte hain aur resistance par sell karte hain, jab tak price range mein rehta hai.
Tools to Identify Support and Resistance
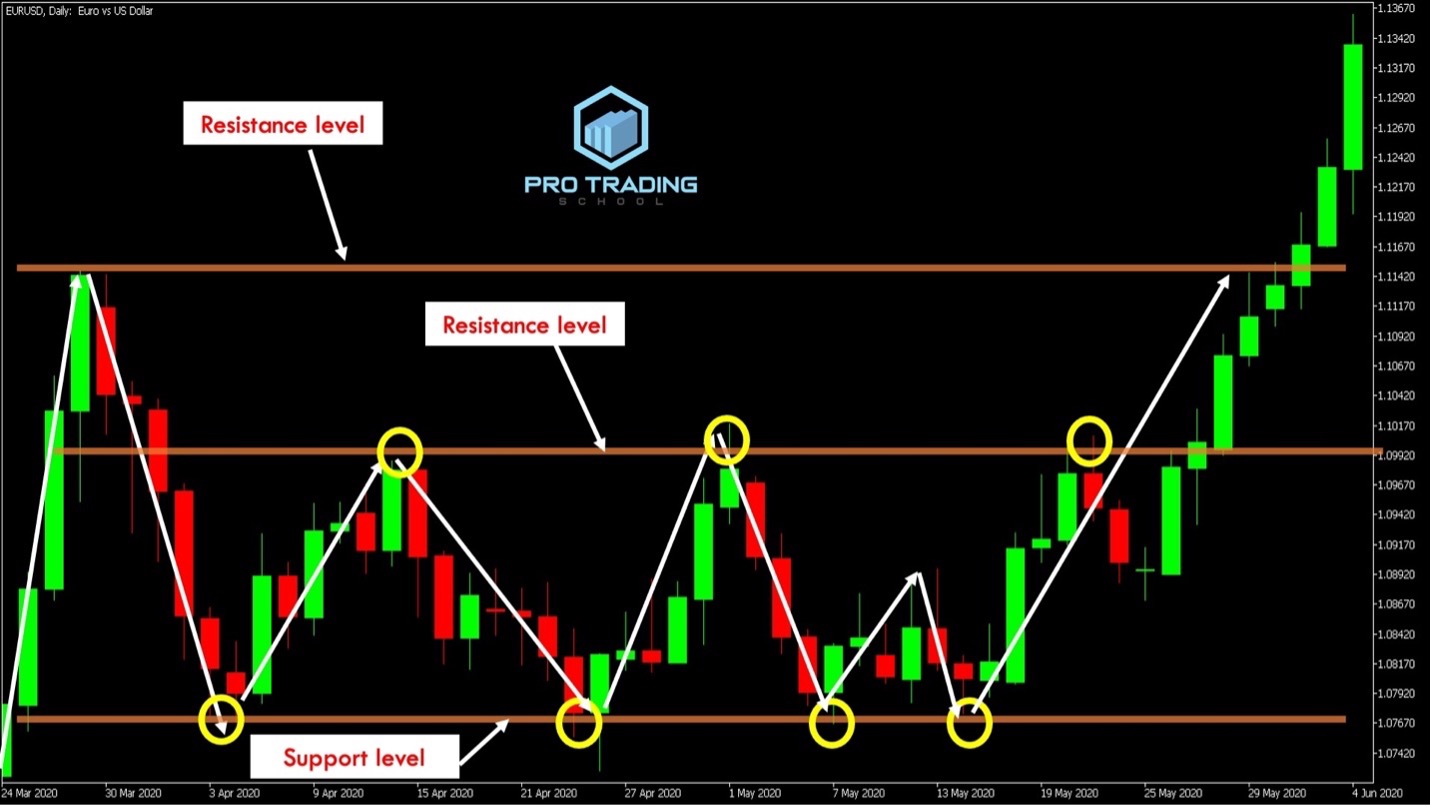
- Horizontal Lines: Sabse simple tareeka support aur resistance ko identify karne ka horizontal lines draw karna hota hai. Aap chart par previous lows aur highs ko connect karke support aur resistance levels identify kar sakte hain.
- Trendlines: Trendlines ko draw karte waqt, aap price ke highs aur lows ko connect karte hain. Agar price line ko break karta hai, to aapko new support ya resistance level ke baare mein sochna chahiye.
- Fibonacci Retracements: Fibonacci retracement levels ko bhi aap support aur resistance identify karne ke liye use kar sakte hain. Yeh mathematical levels market ke natural retracements ko predict karte hain.
Conclusion
Support aur resistance levels aapko market ki price action ko samajhne aur successful trades execute karne mein madad karte hain. Yeh levels aapko market ke potential reversal points ke baare mein bata kar aapki trading decisions ko guide karte hain. Support aur resistance ko identify karte waqt, aapko previous highs, lows, trendlines, volume analysis aur psychological levels ka dhyan rakhna hota hai. Yeh tools aapko market ke dynamics ko better understand karne mein madad karte hain, jo aapke trading strategies ko zyada effective bana sakte hain.
4o mini