Stock trading aur investing mein, Moving Averages (MA) ek fundamental aur widely used tool hain. Ye indicators aapko market trends ko identify karne, price fluctuations ko smooth karne, aur trading decisions ko optimize karne mein madad karte hain. Is article mein, hum Moving Averages, specifically Simple Moving Average (SMA) aur Exponential Moving Average (EMA) ke beech ka difference samjhenge, aur in dono ko kaise effectively use kiya jaa sakta hai, is par discuss karenge.
What is a Moving Average?
Moving Average (MA) ek trend-following indicator hai jo price data ko average karta hai aur usse ek smooth line banata hai. Moving averages ka basic function market ki price fluctuations ko smooth karna aur trends ko clearly identify karna hota hai. Aap inhe technical analysis mein price action ke analysis ke liye use karte hain.
Moving averages ka calculation price data ko average karne par based hota hai. Yeh aapko stock ya market ki overall direction (bullish ya bearish) samajhne mein madad karta hai.
Types of Moving Averages
Jab hum moving averages ke baare mein baat karte hain, to generally Simple Moving Average (SMA) aur Exponential Moving Average (EMA) sabse zyada popular hote hain. Dono moving averages ka purpose price data ko smooth karna aur trends ko identify karna hota hai, lekin in dono ke beech kaafi farq hai.
Aayiye, in dono moving averages ko detail mein samajhte hain:
1. Simple Moving Average (SMA)
Simple Moving Average (SMA) ek basic aur commonly used moving average hai. SMA ek fixed number of periods (jaise 20-day, 50-day, 200-day) ka average nikaalta hai, jo stock ya market ki closing prices par based hota hai. Yeh ek simple average hai jisme past ke closing prices ko equally weight diya jaata hai.
How is SMA Calculated?
SMA ka calculation simple hai. Agar aap 10-day SMA calculate kar rahe hain, to aapko pehle pichle 10 dinon ke closing prices ko add karna hoga, phir unhe 10 se divide karna hoga. Yeh process har naya day ke saath repeat hota hai, aur ek smooth line ban jaati hai.
For example, agar aapko 5-day SMA calculate karna ho, to formula yeh hoga: SMA=(P1+P2+P3+P4+P5)5SMA = \frac{(P_1 + P_2 + P_3 + P_4 + P_5)}{5}SMA=5(P1+P2+P3+P4+P5)
Jahan P1,P2,P3,P4,P5P_1, P_2, P_3, P_4, P_5P1,P2,P3,P4,P5 pichle 5 dinon ke closing prices hain.
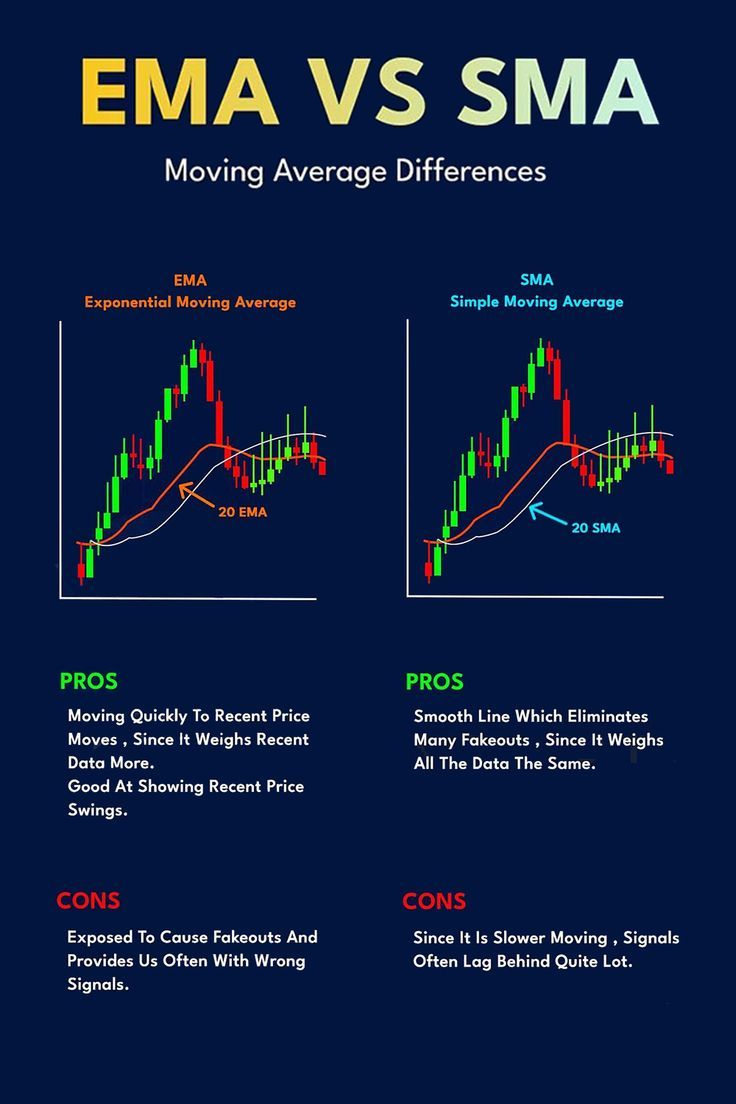
Pros of SMA
- Simplicity: SMA ka calculation kaafi straightforward hai aur use karne mein asaan hai.
- Trend Identification: SMA easily trend ko identify karne mein madad karta hai. Agar price SMA ke upar hai, to market bullish hai, aur agar price SMA ke neeche hai, to market bearish hai.
- Reliable in Trending Markets: SMA ko trending markets mein use karna zyada effective hota hai, kyunki yeh smooth aur reliable signals provide karta hai.
Cons of SMA
- Lagging Indicator: SMA price changes ke baad react karta hai, isliye yeh lagging indicator hai. Yeh aapko market ke current trend ke baare mein immediately batata nahi hai.
- Slow to React to Price Movements: SMA sudden price movements ko react nahi karta aur isliye kabhi kabhi signals delayed ho sakte hain.
2. Exponential Moving Average (EMA)
Exponential Moving Average (EMA), jise ek aur advanced version samjha jaata hai, price data ko average karta hai lekin yeh recent prices ko zyada weight deta hai. EMA ko zyada responsive aur sensitive maana jaata hai, aur yeh price movements ke liye jaldi react karta hai.
How is EMA Calculated?
EMA ka calculation thoda complex hota hai, kyunki isme smoothing factor ko calculate karna padta hai jo recent prices ko zyada weight deta hai. Yeh formula kuch is tarah se hota hai: EMA=(Pt×Multiplier)+(EMAyesterday×(1−Multiplier))EMA = (P_t \times \text{Multiplier}) + (EMA_{yesterday} \times (1 – \text{Multiplier}))EMA=(Pt×Multiplier)+(EMAyesterday×(1−Multiplier))
Jahan:
- PtP_tPt aaj ka price hai.
- EMAyesterdayEMA_{yesterday}EMAyesterday kal ka EMA hai.
- Multiplier ka calculation formula hota hai:
Multiplier=2N+1\text{Multiplier} = \frac{2}{N + 1}Multiplier=N+12
Yahaan N wo number of periods hai, jise aap select karte hain (jaise 10-day, 50-day).
Pros of EMA
- Faster Reaction to Price Changes: EMA quickly price changes ko react karta hai aur price movements ko jaldi identify karne mein madad karta hai.
- Better for Short-Term Analysis: EMA short-term trends ko accurately track karta hai, aur yeh day trading aur swing trading ke liye useful hai.
- More Weight on Recent Data: EMA recent prices ko zyada importance deta hai, jisse yeh market ke real-time changes ke saath better aligned hota hai.
Cons of EMA
- More Complex Calculation: EMA ka calculation SMA se thoda complex hai aur isliye thoda challenging ho sakta hai.
- Sensitive to Market Noise: EMA ka quick response kabhi kabhi market ke noise ko bhi amplify kar sakta hai, jisse false signals bhi generate ho sakte hain.
SMA vs EMA: Key Differences
Ab hum dekhte hain SMA aur EMA ke beech ka major difference, jisse aapko yeh samajhne mein madad milegi ki kis situation mein kis indicator ka use karna zyada effective hai.
| Feature | Simple Moving Average (SMA) | Exponential Moving Average (EMA) |
|---|---|---|
| Calculation | Simple average of closing prices | Weighted average with more emphasis on recent prices |
| Sensitivity | Less sensitive to recent price changes | More sensitive to recent price changes |
| Lag | Higher lag due to equal weighting | Lower lag due to emphasis on recent data |
| Best for | Identifying long-term trends in trending markets | Short-term trends and fast-moving markets |
| Complexity | Simple to calculate and use | More complex to calculate |
| Market Noise | Less affected by market noise | More sensitive to market noise |
| Use in Strategy | Best for steady, trending markets | Best for volatile, fast-changing markets |
How to Use SMA and EMA in Your Trading Strategy
SMA aur EMA dono ko aap apni trading strategy mein combine kar ke use kar sakte hain, taaki aap apne analysis ko zyada accurate bana sakein.
- Crossover Strategy:
- Golden Cross: Jab short-term EMA (jaise 50-day) long-term SMA (jaise 200-day) ko upar cross karta hai, to yeh bullish signal hota hai.
- Death Cross: Jab short-term EMA long-term SMA ko neeche cross karta hai, to yeh bearish signal hota hai.
- Trend Confirmation:
- Agar price SMA ke upar ho aur EMA bhi price ke upar ho, to market bullish hai.
- Agar price SMA ke neeche ho aur EMA bhi price ke neeche ho, to market bearish hai.
- Support and Resistance:
- Moving averages ko support aur resistance levels ke roop mein bhi use kiya jaa sakta hai. Agar price moving average ke upar ho, to moving average support ka kaam kar sakta hai, aur agar neeche ho, to moving average resistance ban sakta hai.
Conclusion
SMA (Simple Moving Average) aur EMA (Exponential Moving Average) dono hi valuable indicators hain jo aapko market trends aur price action ko samajhne mein madad karte hain. Dono ke apne pros aur cons hain. SMA kaafi simple aur reliable hai long-term trends ke liye, jabki EMA short-term trends ke liye zyada effective hai.
Aap apni trading strategy mein SMA aur EMA ko combine karke zyada accurate aur timely signals paa sakte hain. In indicators ko samajhkar aur practice kar ke aap apni trading strategy ko better bana sakte hain.