Stock market aur trading ke duniya mein, candlestick chart ek powerful tool hai jo price movements ko visualise karne mein madad karta hai. Candlestick charts traders ko market ke sentiments aur trends ko samajhne mein madad karte hain. Agar aap stock trading mein naye hain, to candlestick chart ko samajhna aapke liye zaroori hai. Yeh chart ek visual representation hota hai jo aapko price action, market trends aur patterns dikhata hai. Is article mein, hum aapko batayenge ki candlestick chart kya hota hai aur aap ise kaise padh sakte hain.
What is a Candlestick Chart?
Candlestick chart ek visual representation hota hai jo price data ko ek specific time period mein display karta hai. Har “candlestick” ek time frame ka data show karta hai—ye time frame minute, hour, day, week ya month ho sakta hai. Har candlestick 4 key price levels ko represent karta hai:
- Open: Woh price jahan se trading start hui thi.
- Close: Woh price jahan trading khatam hui thi.
- High: Woh highest price jo us time period mein reach kiya gaya.
- Low: Woh lowest price jo us time period mein reach kiya gaya.
Candlestick chart ka basic concept samajhna aapko price action aur trends ko identify karne mein madad karega.
Components of a Candlestick
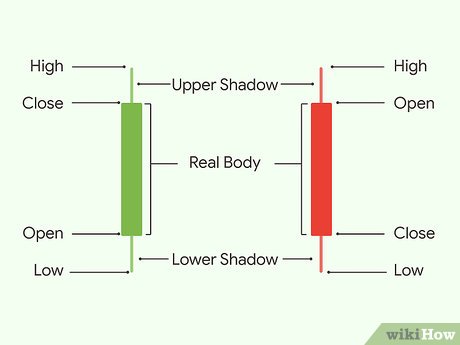
Ek candlestick ki do main parts hote hain:
- Body: Body woh rectangle hoti hai jo open aur close ke beech ka range show karti hai. Agar close price open price se upar hai, to body green ya white hoti hai (jo bullish trend ko indicate karti hai). Agar close price open price se neeche hai, to body red ya black hoti hai (jo bearish trend ko indicate karti hai).
- Wicks (or Shadows): Body ke upar aur neeche jo lines hoti hain, unhe wicks ya shadows kehte hain. Upper wick high price aur lower wick low price ko indicate karta hai.
- Upper wick: Yeh line show karti hai ki price us time period mein kis maximum point tak gaya.
- Lower wick: Yeh line show karti hai ki price kis minimum point tak gaya.
Types of Candlesticks and Their Meaning
Candlestick chart mein different types of candlesticks hoti hain, jo market sentiment ko indicate karti hain. Sabse common candlesticks hain:
- Bullish Candlestick: Jab price open ke comparison mein close hoti hai, to yeh bullish candle hoti hai, jisme body green ya white hoti hai. Iska matlab hai ki demand zyada thi aur prices ne upward movement dikhayi.
- Bearish Candlestick: Jab price open ke comparison mein close se neeche hoti hai, to yeh bearish candle hoti hai, jisme body red ya black hoti hai. Iska matlab hai ki selling pressure zyada tha aur prices ne downward movement dikhayi.
- Doji Candlestick: Doji candlestick tab banta hai jab open aur close price almost same ho. Yeh indecision ko dikhata hai—market mein na to buying aur na hi selling ka clear trend hai. Doji candlesticks ke around zyada careful analysis ki zaroorat hoti hai.
- Hammer and Hanging Man: Hammer candlestick ek bullish reversal pattern hai jab price neeche gir kar fir upar close hota hai. Yeh generally market ke bearish trend ke baad banta hai. Hanging Man bhi similar hota hai, lekin yeh bearish reversal ko indicate karta hai, jab market ke bullish trend ke baad yeh pattern banta hai.
- Engulfing Patterns: Engulfing pattern ek two-candlestick pattern hota hai jisme ek candle dusri candle ko completely engulf karti hai. Agar ek bullish candle puri tarah se bearish candle ko engulf karti hai, to yeh bullish reversal ko indicate karta hai, aur agar bearish candle bullish candle ko engulf karti hai, to yeh bearish reversal ko indicate karta hai.
How to Read a Candlestick Chart
Ab jab aapko candlestick ki basic understanding ho gayi hai, toh chaliye samajhte hain ki aap actual candlestick chart ko kaise read kar sakte hain.
- Identify the Trend: Pehle trend ko identify kijiye. Agar prices consistently upar ja rahe hain, to market bullish hai. Agar prices consistently neeche ja rahe hain, to market bearish hai. Is trend ko samajhna aapko trading decisions lene mein madad karega.
- Look for Reversal Patterns: Jab aap bullish ya bearish trend dekhte hain, toh reversal patterns pe dhyan dein. Agar market kisi direction mein move kar raha hai aur suddenly doji ya hammer pattern appear hota hai, toh yeh signal de sakta hai ki trend reverse ho sakta hai.
- Candlestick Confirmation: Jab koi reversal pattern ban raha ho, toh aapko us pattern ko confirm karne ke liye ek additional candle dekhni chahiye. Agar agla candle expected direction mein move karta hai, toh pattern confirm ho jata hai.
- Volume Analysis: Candlestick chart ko volume ke saath analyze kijiye. Agar koi bullish candlestick high volume ke saath aata hai, toh iska matlab hai ki buying pressure strong hai. Agar low volume ke saath bullish candle aata hai, toh ho sakta hai ki trend sustainable na ho.
- Support and Resistance Levels: Candlestick chart ke saath support aur resistance levels ko bhi identify kijiye. Jab price support level ke paas hoti hai aur bullish candlestick banta hai, toh yeh buying opportunity ko indicate karta hai. Similarly, resistance level ke paas bearish candlestick banna, selling pressure ko indicate karta hai.
Candlestick Patterns for Trading
Traders generally kuch popular candlestick patterns ke through market direction predict karte hain. Kuch common candlestick patterns jo aapko pehchanne chahiye:
- Bullish Engulfing: Jab ek red candle ke baad ek large green candle aata hai jo pehle wale candle ko engulf karta hai, toh yeh bullish reversal ko indicate karta hai.
- Bearish Engulfing: Jab ek green candle ke baad ek large red candle aata hai jo pehle wale candle ko engulf karta hai, toh yeh bearish reversal ko indicate karta hai.
- Morning Star: Yeh pattern ek bearish trend ke baad banta hai, jisme pehle ek large red candle, phir ek small candle, aur uske baad ek large green candle hoti hai. Yeh bullish reversal ko indicate karta hai.
- Evening Star: Yeh pattern bullish trend ke baad banta hai, jisme pehle ek large green candle, phir ek small candle, aur uske baad ek large red candle hoti hai. Yeh bearish reversal ko indicate karta hai.
- Shooting Star: Yeh ek single candlestick pattern hai jo market ke bullish trend ke baad banta hai. Isme body chhoti hoti hai aur upper wick kaafi lambi hoti hai, jo bearish reversal ko signal karta hai.
Candlestick Chart vs Bar Chart
Candlestick chart aur bar chart dono price data ko show karte hain, lekin candlestick chart zyada visual aur easy-to-understand hota hai. Bar chart mein aapko open, close, high, and low price ko alag se dekhna padta hai, jabki candlestick chart mein aap easily trends aur patterns identify kar sakte hain.
Conclusion
Candlestick charts stock market aur trading mein ek essential tool hain. Inka use karke aap market ke sentiments ko samajh sakte hain aur apni trading strategies ko improve kar sakte hain. Candlestick patterns ko samajhna aur unhe identify karna trading ka ek art hai, jo practice se improve hota hai. Agar aap beginner hain to practice karte rahiye aur gradually complex patterns ko samajhne ki koshish kijiye. Time ke saath aapko apni trading aur investing decisions mein clarity milegi.